What OpenAI changed on 22 September 2026
OpenAI shipped an improved prompt caching system alongside the GPT-6 family. Three things changed at once: higher cache hit rates by default, a 30-minute eligibility window for shared prefix reuse, and a new set of developer tools — a dashboard, a diagnostics API, explicit cache breakpoints, and a prewarming endpoint. The discount structure stays the same: up to 90% off cached input tokens. The mechanics for hitting that ceiling have become significantly more controllable.
The new controls are optional add-ons to the default engine, not replacements for it. Existing integrations keep working. Teams that tune against the new tooling have published material gains — the evidence below is specific about what those teams did and what conditions applied.
Why OpenAI made this change
GPT-6 is designed for long-running, multi-turn agents: codebase refactoring, document research, multi-step reasoning chains that span hours. Those workloads generate API requests that share large prefixes — the same system prompt, the same tool definitions, the same reference context, carried forward turn after turn.
As agents grew longer and more complex, cache misses became expensive in both latency and cost. A single tool definition change could invalidate the cache for thousands of tokens, with no structured signal that it had happened. OpenAI’s response is to give developers visibility into exactly why a miss occurred and precise controls to prevent the next one.
Who this affects
Any team calling the GPT-6 API with repeated context is in scope: session-based chat products, coding assistants, document-processing pipelines, and agentic workflows that fork conversations for background tasks. The impact scales with prompt length and request volume. Short, one-shot prompts will see little difference. Long-context, high-frequency workloads are where the cost reduction concentrates.
GitHub Copilot is the clearest public reference point. Mario Rodriguez, Chief Product Officer, stated that Copilot reduced the share of prompt tokens requiring fresh processing by more than 50% relative to their previous baseline, across billions of requests to OpenAI models. Fewer tokens requiring fresh processing means more tokens served from cache — that is the direction of the gain, not a cost increase.
Concrete capabilities — and their limits
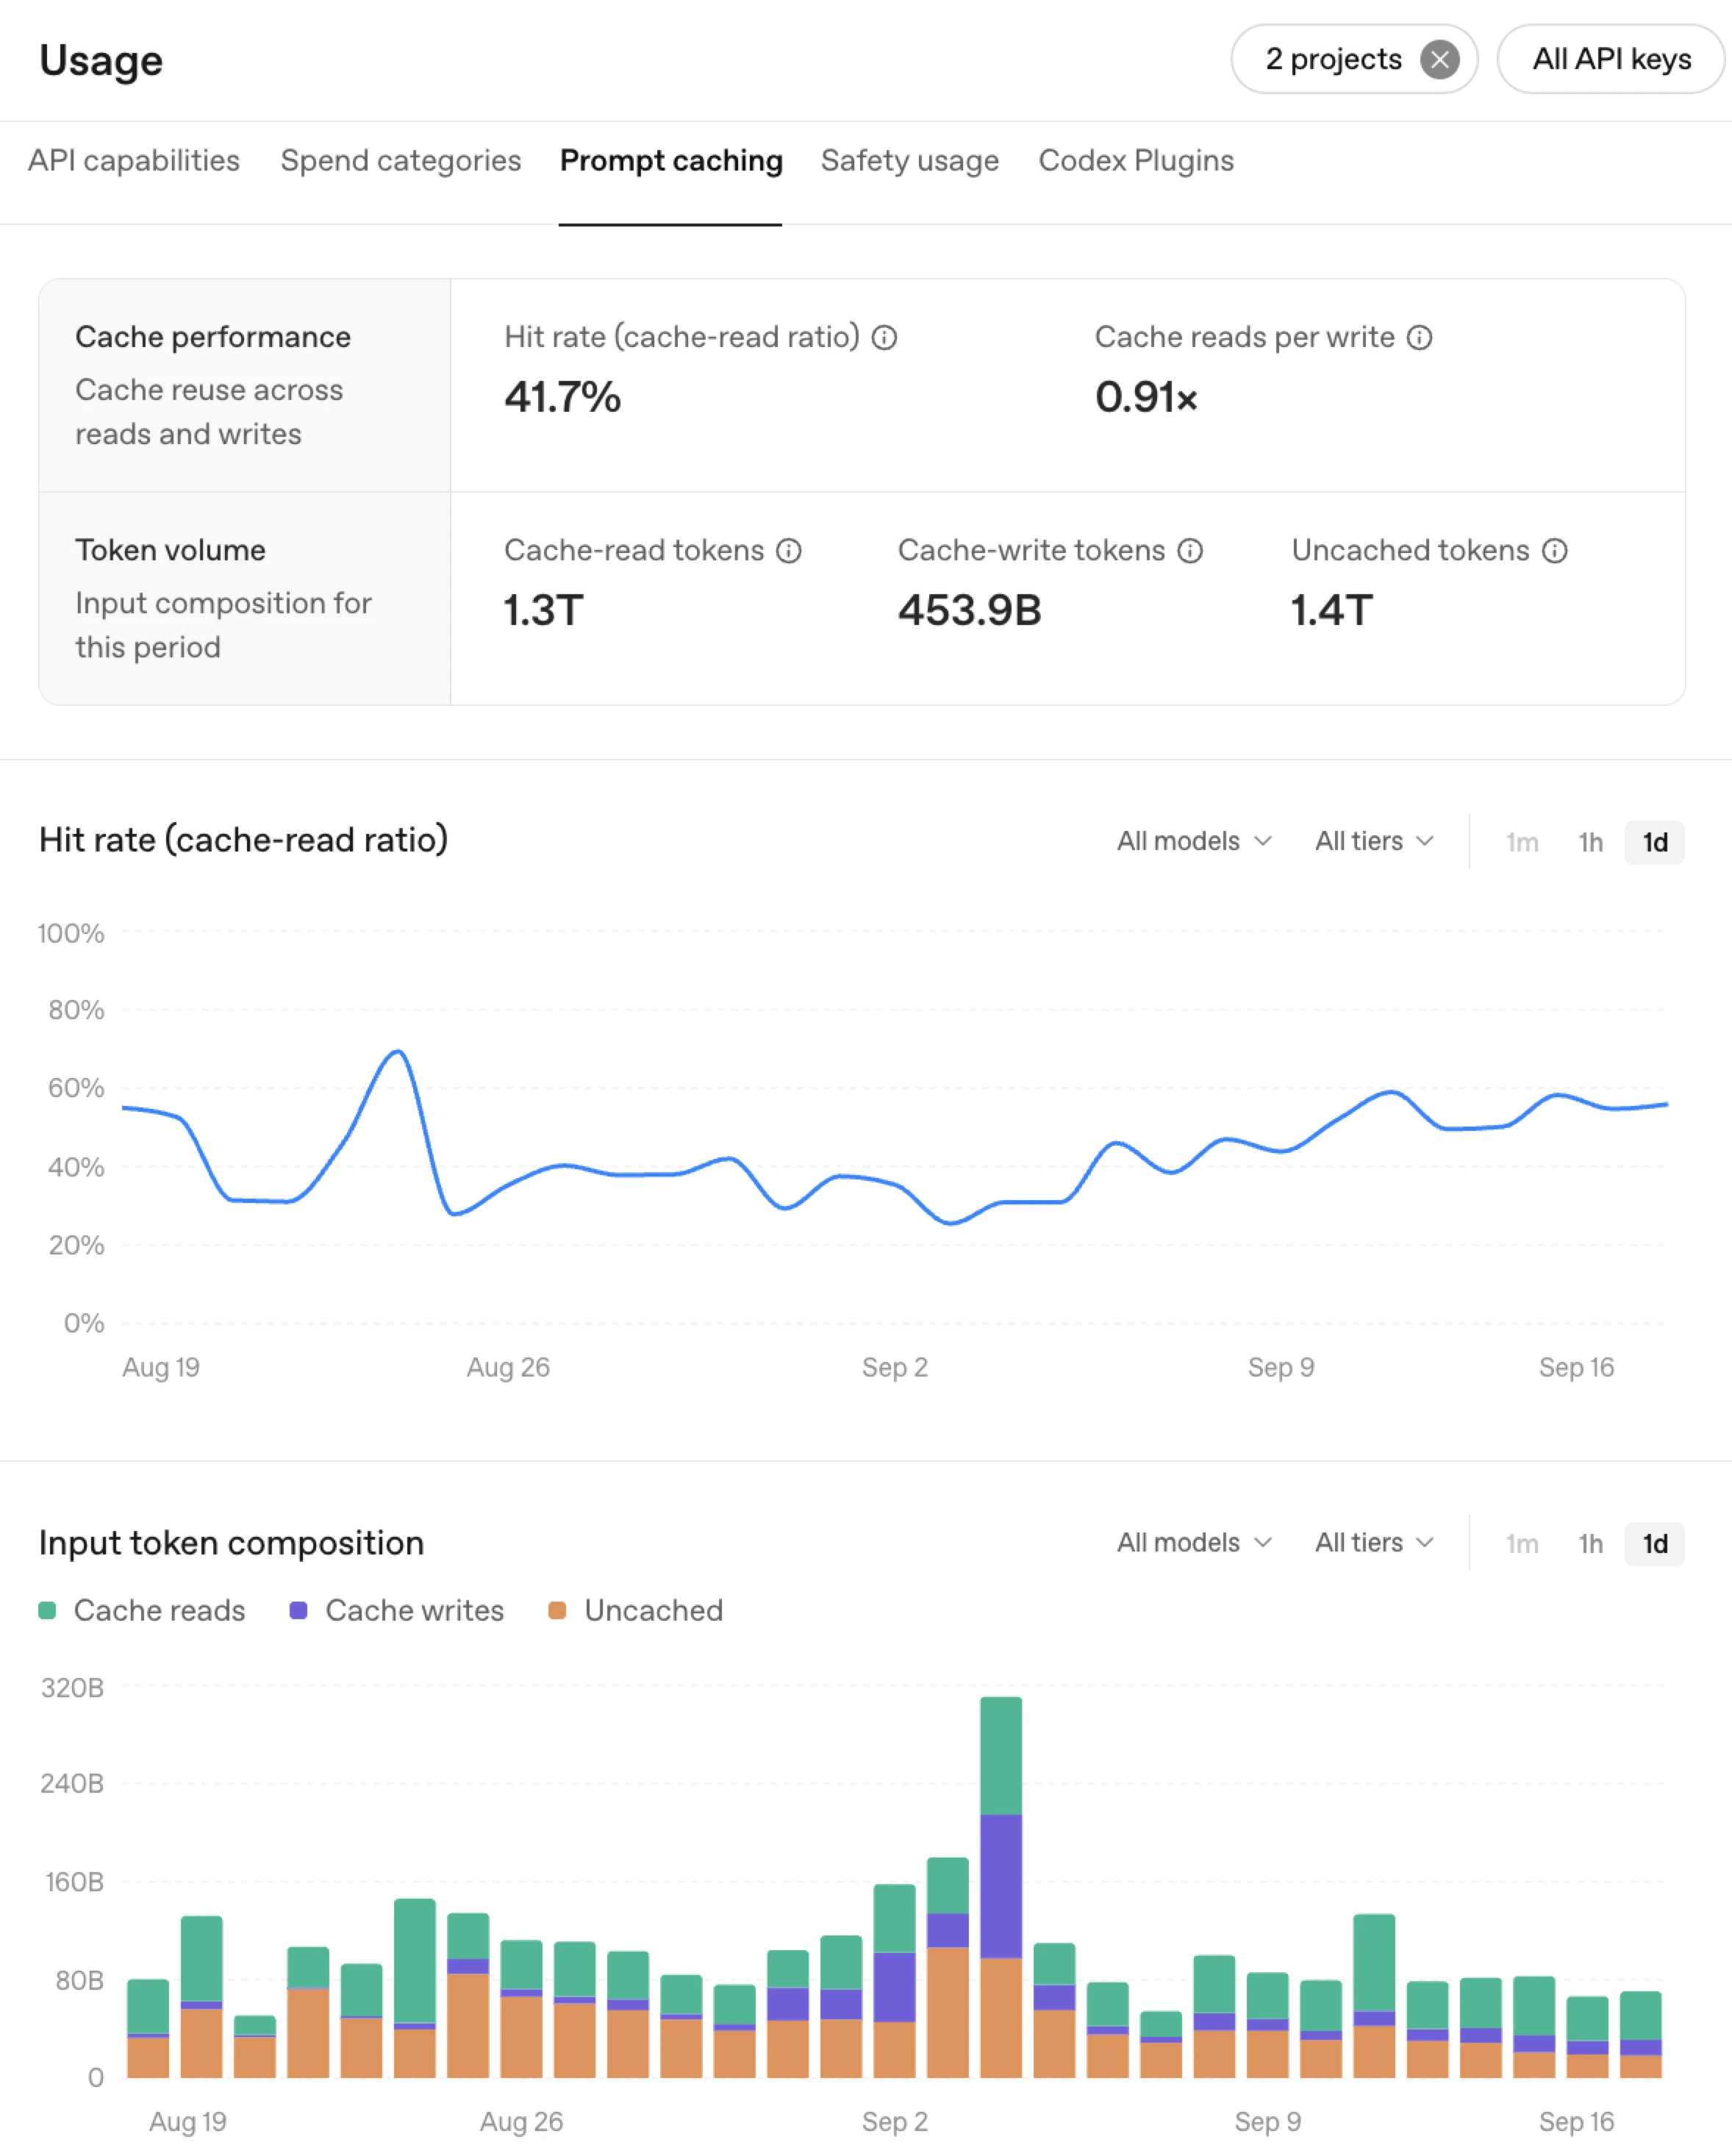
The Prompt Caching Dashboard (platform.openai.com/usage) shows hit rates over time and an input composition chart breaking down cached versus uncached tokens. It is a monitoring surface — it tells you what is happening, not what to fix.
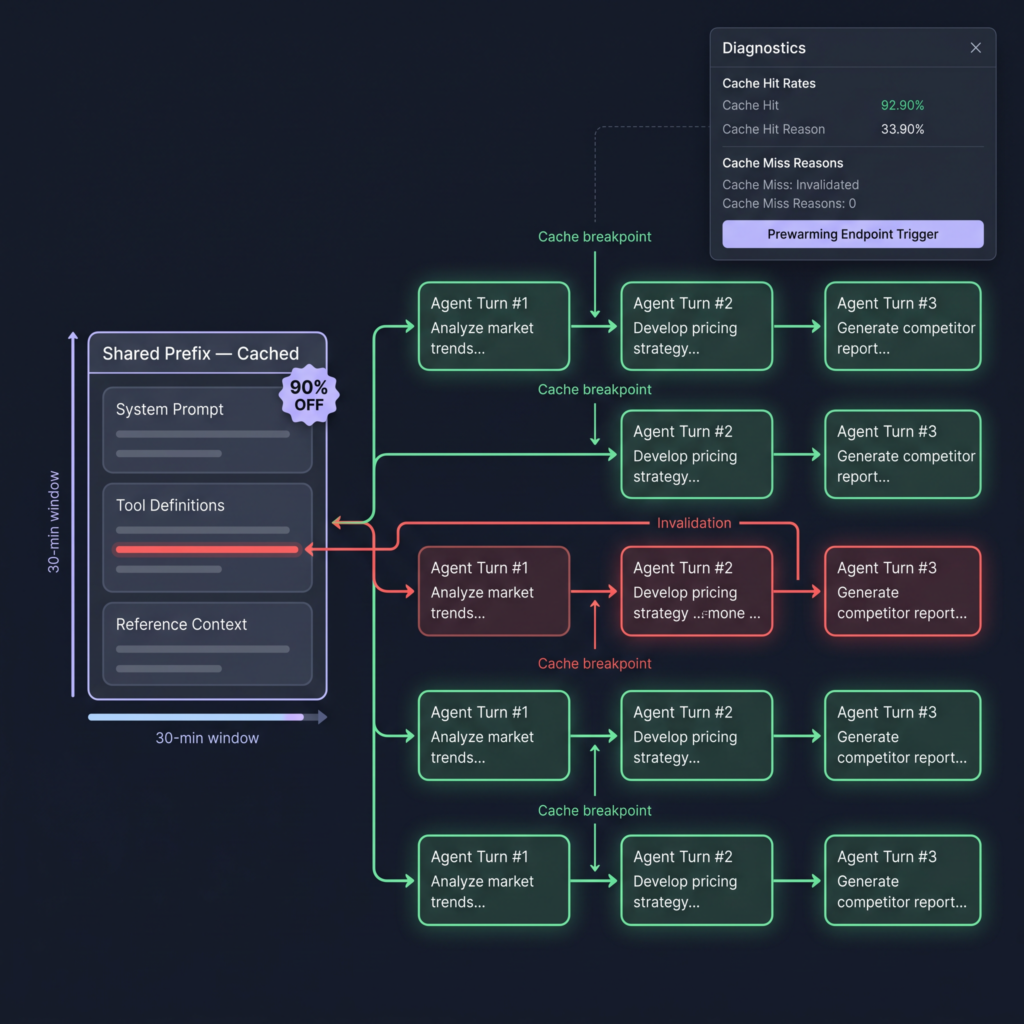
The diagnostics tool (diagnostics guide) fills that gap. It compares a cache-miss request against a recent cached response and returns a structured reason — for example, tools_changed — along with an estimated token count for the affected prefix. You get both the cause and the size of the impact.
Explicit cache breakpoints let you declare which prefixes to reuse rather than relying entirely on automatic detection. The updated prompt caching guide covers breakpoint placement, prefix eligibility duration, and how tool changes interact with reuse. One practical constraint: the 30-minute window means very infrequent requests may not benefit unless you use prewarming.
Prewarming lets you load shared context — system instructions, tool schemas, reference material — before the first user request arrives, moving that processing cost out of the user’s wait time. It is most useful for applications with a predictable startup sequence.
Mid-conversation reasoning effort changes are now possible without breaking the cache. Append a configuration_update to raise or lower reasoning effort for a specific turn while leaving the cached prefix intact. The reasoning effort guide explains how to apply this in practice.
What the production results look like
Three teams published specific numbers alongside the OpenAI announcement on 22 September 2026.
Manus moved from roughly 85% cache hit rate to consistently above 90% in under a week by combining explicit and automatic caching and using real requests to locate unexpected misses. Bin Fan, Agent Team Lead, attributed the gain to targeted improvements validated jointly with OpenAI’s engineering team.
Wordsmith saw cache hit rates on evaluations rise from 83% to 91% after switching to explicit breakpoints. Cache writes fell by roughly two-thirds. Inference costs dropped by 36%. Eugene Mikhantyev, AI Engineer, noted the workload stayed constant — the savings came purely from better prefix reuse.
Strawberry Browser also participated in the rollout; specific metrics were not disclosed in the announcement.
A fair counterpoint: Manus and Wordsmith worked directly with OpenAI’s engineering team during the rollout. Teams optimising independently may see smaller initial gains and a longer tuning cycle. A lower starting hit rate means more room to improve, but it does not guarantee the same magnitude of result. The diagnostics tool is designed to close the access gap, but it requires deliberate iteration rather than a one-time configuration change.
How to implement this now
Start with the dashboard. Establish your current hit rate as a baseline before touching any code. Then run the diagnostics tool against your most expensive cache-miss patterns — sort by token count, not by frequency. Fix the largest prefixes first.
When you add explicit breakpoints, keep tool definitions, schemas, and ordering stable. Use allowed_tools to restrict which tools are callable at a given turn rather than removing definitions from the prompt. Append new instructions at the end of the context using developer messages instead of rewriting earlier ones. Both practices preserve the reusable prefix. See OpenAI’s guidance on managing tool changes for the full pattern.
If your application has a predictable startup sequence, add prewarming. It is a low-effort change with a direct benefit to first-response latency.
The one action to take today: open the Prompt Caching Dashboard, record your current hit rate, and schedule 30 minutes to run the diagnostics tool against your three highest-volume endpoints. That baseline reading will tell you whether you have a quick win or a deeper integration to plan.
— Eagentix
Eagentix helps growth-focused enterprises redesign and automate manual business processes. We combine executive strategy, implementation support, and managed services to build dependable operations across Southeast Asia.
Eagentix helps growth-focused enterprises redesign and automate manual business processes. We combine executive strategy, implementation support, and managed services to build dependable operations across Southeast Asia.
Sources
- Prompt Caching Dashboard(opens in a new window)
- Prompt caching dashboard showing cache hit rate, cache performance over time, and input token composition.
- prompt caching diagnostics tool(opens in a new window)
- prompt caching guide(opens in a new window)
- change reasoning effort(opens in a new window)
- guidance on managing tool changes(opens in a new window)
- Prewarming(opens in a new window)
- use Codex(opens in a new window)
- Introducing GPT-6 Sol and Luna — Art card
- Reimagining advertising with AI — Card cover
- How to connect AI usage to business value — art card